← All work

Case study 03 · SERNAGEOMIN

✓ Shipped✦ AI

Cero Accidente: an AI ranking inspectors could trust

Chile's mining safety agency had about 50 inspectors for 3,905 mines. A model ranked every mine by risk; I designed the tool that shows inspectors why each mine ranks where it does, so they could plan their visits by it.

HEADFRAMEHOISTNEXT INSPECTIONCERO ACCIDENTE · 3,905 MINES
Section view. Orange marks the one thing the tool decides: where to inspect next.SHEET 01
Client
SERNAGEOMIN, via Inria Chile
Years
Oct 2018 – Feb 2019
Role
Lead UX designer
Team
Me, 1 developer, 1 data scientist, 1 ontology researcher
Methods
Field research, ontology, explainable AI
3,905mines in the national registrySERNAGEOMIN
~50inspectors for the whole countrySERNAGEOMIN
~10,000inspections a yearSERNAGEOMIN
+45%of mines reached, 2019–2021SERNAGEOMIN, 2019–2021
01

Context

From inspecting on a schedule to inspecting by risk

Mining is more than 14% of Chile's GDP and more than half of its exports. SERNAGEOMIN inspects mines to prevent accidents, but with about 50 inspectors and 3,905 mines, each visit has to count. The agency wanted to move from preventive, calendar-based inspections to predictive ones, based on data.

02

Role and team

I designed the tool and, with an ontologist, the structure under the model

I led the design: research, information architecture and interface. With the ontology researcher I built the information architecture that became the base for both the data-entry process and the predictive model. The data scientist built the model; the developer built the platform.

03

Problem

The data that would predict risk was on paper

Inspection records weren't digitized. Deciding where to go relied on inspectors' experience. Of the 3,905 mines, 1,316 were medium or small and about 15% were inactive, so a simple list gave little guidance.

A ranking alone wouldn't be enough: inspectors are experts, and they won't follow a number they can't explain.

04

Research

I went down the mine

I ran five sessions with the inspection coordinator and joined an inspection. Inspectors worked with a flashlight in hand and paper documents, and did the final review outside the mine, in bad light.

  1. 01 / PaperRecords lived on paper, so the first job was a data-entry process.
  2. 02 / TrustInspectors needed the reason behind a rank, not just the rank.
  3. 03 / DistanceTravel shapes the schedule: nearby mines are visited together.
05

Decisions

Rank, then explain

D1 · Explainability

Show the points behind every rank

Each mine's score breaks into four categories. Years since the last inspection weighs most, then pending corrective measures, so inspectors can see and question the reason.

D2 · Fairness

Rank large and small mines separately

A small mine and a large one carry different risks. Mixing them would push every small mine to the bottom.

D3 · Planning

Plan by place

A prioritization polygon groups nearby mines, so one trip covers several high-risk sites.

D4 · Structure

One mine chart instead of tabs

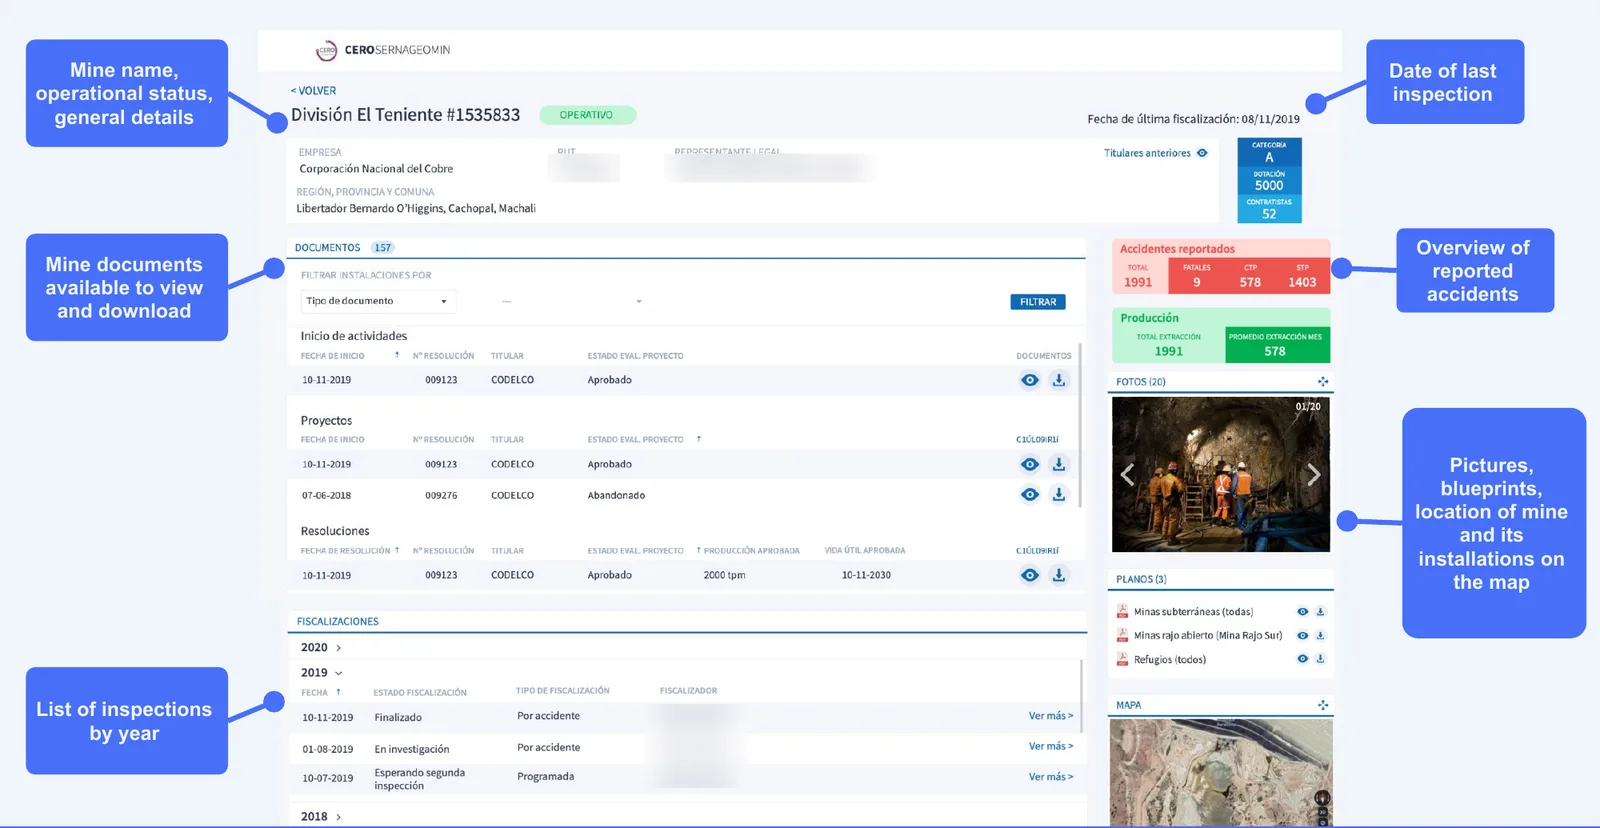
The client's draft spread a mine's data across tabs. I merged it into one chart that reads top to bottom.
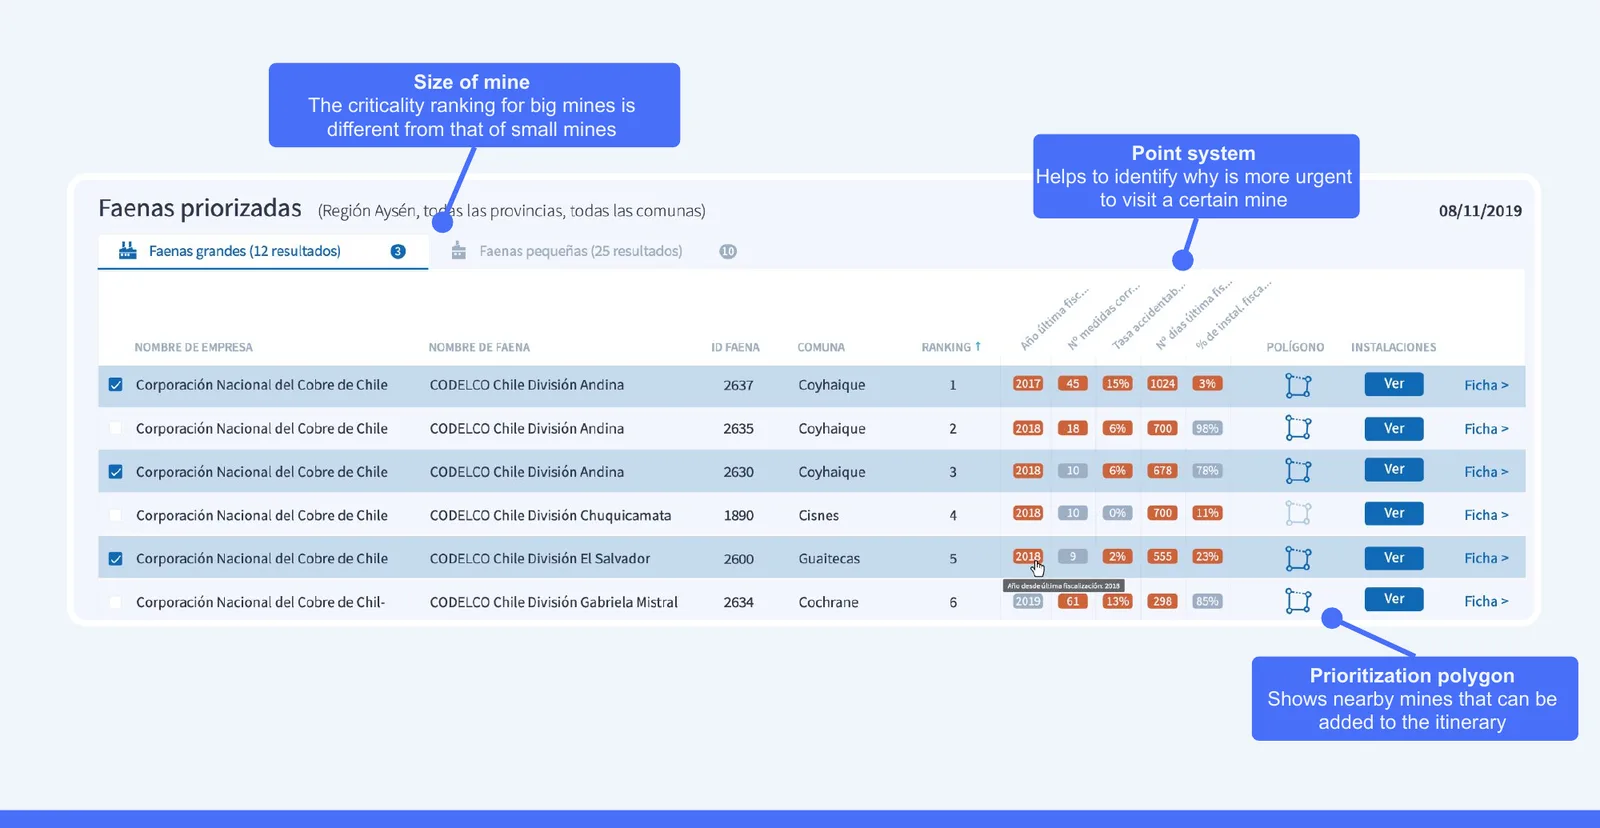
The ranked list of large mines in one region, with each mine's points by category, a polygon icon to add nearby mines to a trip, and notes explaining the size split and the point system.
The score, opened up. Points in four categories explain every rank; large and small mines are ranked apart.FIG. 01
The mine chart: name and status, documents, reported accidents, production, photos, plans, the map and every inspection by year.
Tabs to one page. Everything an inspector checks before a visit, in reading order. Names and ID numbers are blurred.FIG. 02
06

Result

The scheduler inspectors used to plan their visits

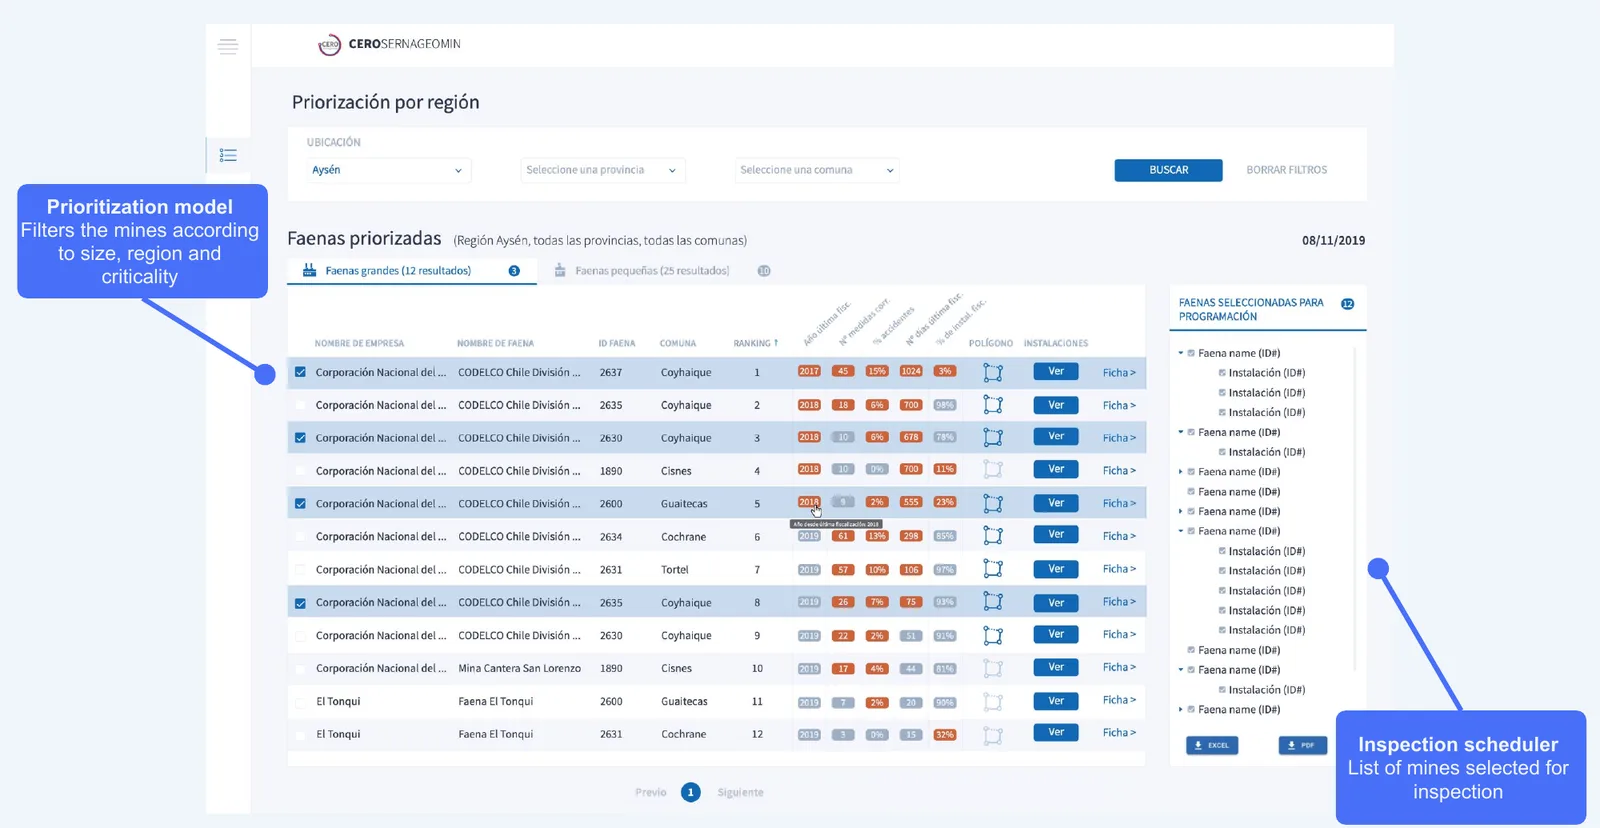
The inspection scheduler: filters by region, province and commune; the ranked list of mines; and the list of mines selected for the next inspection trip.
Inspection scheduler. Filter by place, read the ranking, pick the mines for the next trip.FIG. 03
07

Outcome

More mines reached with the same inspectors

Cero Accidente · coverage

Inspectors reached 45% more of the mines

100100145+45%20192021COVERAGE INDEX
SERNAGEOMIN, 2019–2021
Cero Accidente · the AI model

The model ranked risk twice as well as the experts' scoring

Experts' model1.00AI model2.21+121.2%0
Model evaluation · relative NDCG, experts' ranking = 1.00
  • The scheduler became the agency's primary inspection planning tool.
  • Inspections held steady at about 10,000 a year, so the coverage gain came from better targeting, not more visits.
NoteSERNAGEOMIN's wider Zero Accident program also reported 50% fewer fatalities. That's a program result with many causes, so it isn't claimed here as this tool's impact.
08

Reflection

What I'd do differently

✓ What workedGoing to the mine. Seeing the light, the paper and the travel changed what the scheduler had to do.
↺ What I'd changeI worked part-time, which opened a gap between design and implementation. Today I'd stay closer to the front-end.