Entering data for someone else
Researchers fill in what ANID requires, but get nothing back: they can't see their available funds, their productivity status, or export their CV.
Case study 02 · AC3E
◐ In discovery✦ AIGESTIN, a research center's internal platform, existed to report to ANID, Chile's national research agency. Researchers entered data and got nothing back, while finance, development and technology transfer ran on spreadsheets beside it. I interviewed six groups and reframed the project: from a form redesign into a management intranet, starting with a billing dashboard for the director.
AC3E is a Chilean research center in electrical and electronic engineering, funded by ANID and by contracts with industry. GESTIN, its internal platform, collects what the center must report to ANID: publications, theses, projects, outreach.
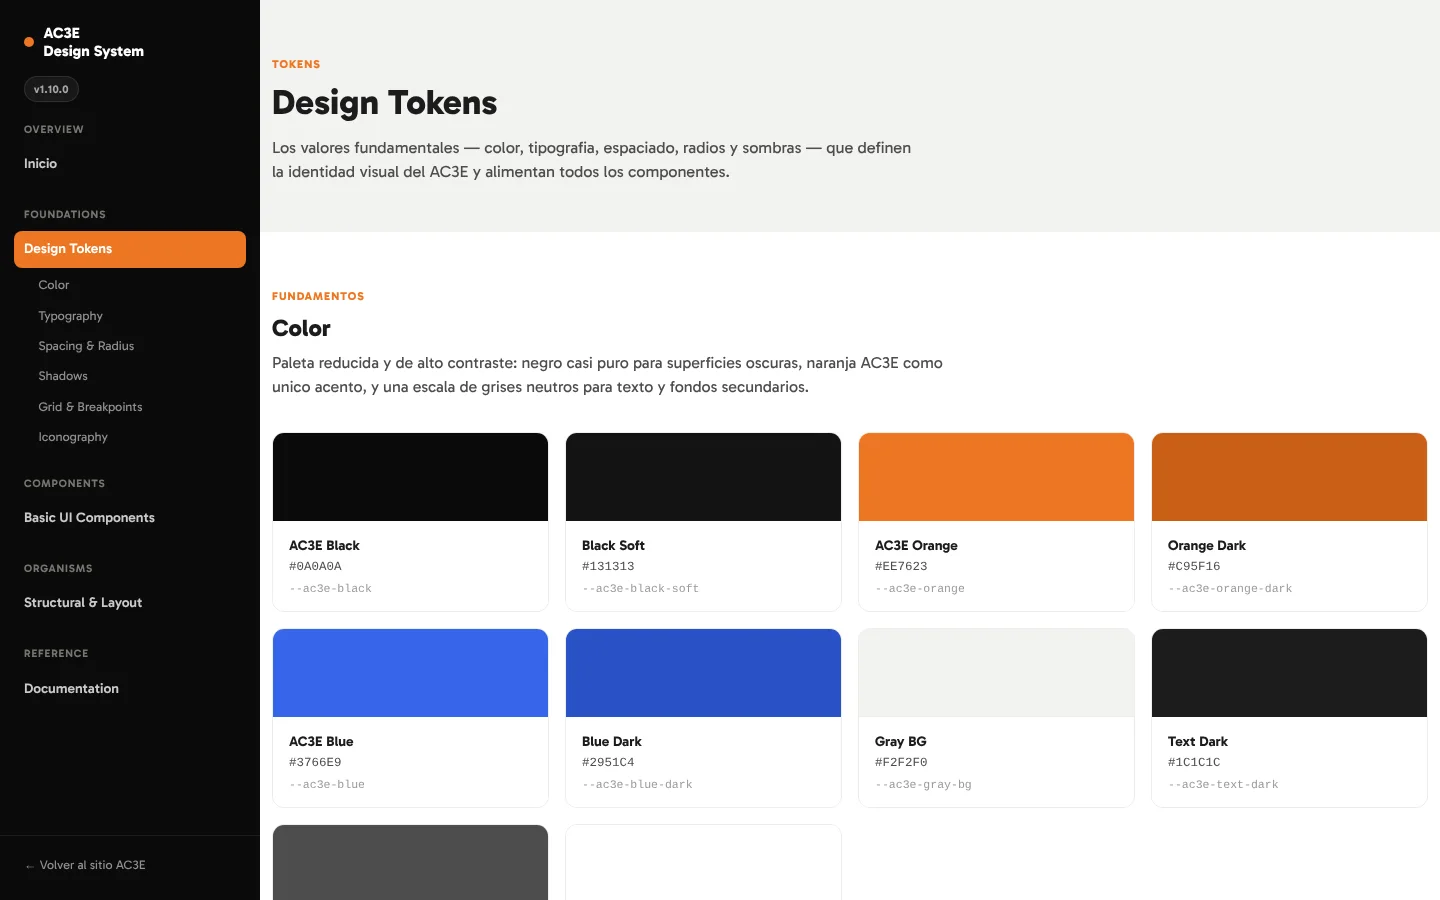
Over time the center grew. Direction now tracks a target for industry billing, operations manages core funding on a financial year that starts in December, development runs projects with monthly costs and income, and technology transfer runs a sales pipeline. None of that lives in GESTIN.
I lead the UX and UI of the redesign: interviews, the diagnosis, user profiles, the roles and permissions model, and the first designs. Earlier, I redesigned the center's public website, built with AI from my research and specs.
Over two weeks I ran 7 interviews with direction; operations, finance and people; development; technology transfer; communications; and researchers at three levels of seniority.
GESTIN had two researcher profiles: lead and associate. Interviews showed three levels with different jobs: associates who only see their own records; line leads who check their whole line every month; and area coordinators who build the story for ANID across two or three lines.
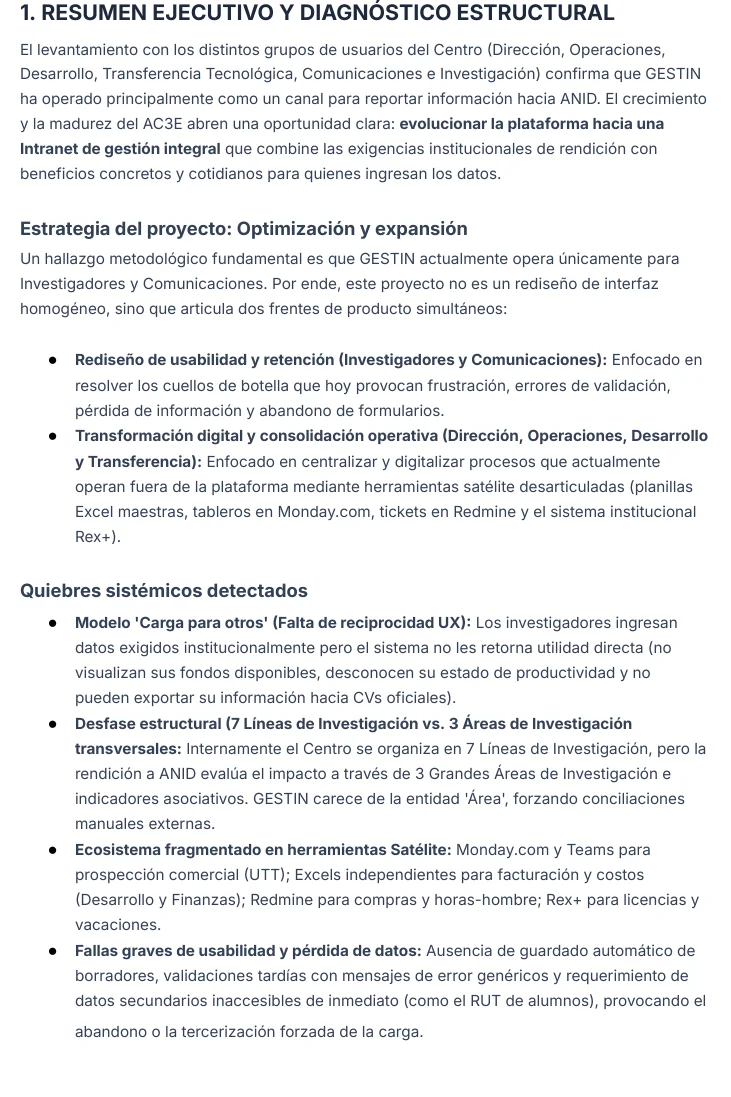
Researchers fill in what ANID requires, but get nothing back: they can't see their available funds, their productivity status, or export their CV.
The center is organised in 7 research lines; ANID evaluates 3 areas and cross-line work. GESTIN has no area, so coordinators reconcile it in Excel.
Sales prospects in Monday and Teams, billing and costs in separate spreadsheets, purchases and hours in Redmine, holidays in Rex+.
No draft autosave, generic errors shown only at the end, and required fields people don't have at hand, like a student's ID number. People give up, or hand the task to someone else.
GESTIN only served researchers and communications. So the project became two fronts at once:
That meant going from 2 user profiles to 10, each with its own scope, permissions and outputs:
| Role | Sees | Can change | Gets out |
|---|---|---|---|
| Super administrator | Everything, plus logs | Full control; can act on behalf of others | Database, backups, logs |
| Associate researcher | Own records | Own records; holiday requests | Personal spreadsheet, standard CV |
| Line lead | Own records + whole line | Own records; signs off the line | Line spreadsheet, annual report |
| Area coordinator | Own records + 2–3 lines | Own records; assigns work to areas | Cross-line metrics, ANID report |
| Direction | Whole center: finance, projects, indicators | Read only | Executive reports, billing |
| Technology transfer | Pipeline, R&D contracts, TRL | Leads and transfer records | Sales funnel, ANID dimension 7 |
| Development | Formal projects, finance, hours | Billing, costing, hours, purchases | Billing calendar, team hours |
| Operations | Whole center: core finance, people | Budgets, holidays, contracts | Financial balances, payroll |
| Communications | Outreach, events, press, awards | Press, clippings, asset library | Media coverage, attendance |
| Guest auditor | Dashboards the admin authorizes | Strictly read only | Official audit reports |
Preliminary roles matrix, after the first round of interviews. To be refined with development and direction.
Researchers see their available budget and deadlines, request holidays, and export a standard CV. Entering data starts to pay off for the person doing it.
Lines roll up into areas, so the ANID view and cross-line work are computed, not rebuilt in Excel every year.
The financial year starts in December; scientific indicators follow other calendars. Every view says which year it uses, and you can switch.
Projected vs actual, the running total against the target, each area's share, and the pipeline: no more reports requested by email.
These directions are being validated with AC3E's development and direction teams before detailed design.
Interactive prototype · made-up data
Shown in AC3E's own design system, with a switch to the portfolio style. Change the year and the area, read the variance summary, and draft a note for the board that you approve before it's added.
Open the prototype →The first phase was the center's public website: new architecture for three audiences (industry, academia and funders), a trilingual site and a documented design system. I did the research, the information architecture, the mood boards and the specs; AI tools did the drafting and the building.